There are 9 Wastes in the Lean Waste Wheel

When we think about improving operations and the Lean waste wheel, how many Lean wastes are there really? Correct Answer: At least 9.

This is in reference to the original 7 wastes in Taiichi Ohno described in his iconic waste wheel, shown below. It’s a question that comes up from time to time and one that Lean aficionados like to debate. Apparently there are tightly-held beliefs on this topic. I say, let’s not over complicate something that Ohno intended to be quite simple. But because waste is the red thread that runs through all of Lean, it’s worth consideration.

What we now know, is that there are actually 9 wastes in the Lean waste wheel. I know, I know – some who read this will be offended at first. So be it. I am confident that Taiichi Ohno would be open to this continuous improvement, even in the core of his philosophy. I also suspect he would be offended at the amount of waste generated debating the issue.

The Lean Waste Wheel – Traditional Version

The Lean Waste Wheel by Taiichi Ohno showing 7 wastes and 3 categories as described by Kaufman Global

Ohno’s Iconic waste wheel with the wastes spelled out and categorized – Kaufman Global’s preferred format.

Purists will tell you that there are 7 wastes as described by the sensei and there shall be only 7 wastes. Period. Another faction makes the argument for adding the “waste of people’s intellect” or something similar. This notion has become increasingly popular over the years. Kaufman Global added it long ago, but I’ve always found the classification a bit difficult. Is it intellect, human potential, creativity, insight, involvement, or what? Unlike Ohno’s original 7, these descriptors related to people’s energy seem too variable, too abstract and too difficult to attach to an action. More precision here would be helpful.

The case for waste of intellect arose from the observation that bosses and managers sometimes treat people like cogs instead of active participants in value creation. Ohno’s writings illustrate his own struggles to help us understand the important role of humans in all Lean equations. Who knows why he didn’t include something about people in his original wheel work? Maybe he considered himself an under-cover organizational engineer but felt most comfortable attending to hard assets (inventory and machines) and direct labor (the worker on the floor). Or maybe he didn’t want to too openly point out that management (aka Mr. Toyoda) was missing the point? Or maybe the culture he was dealing with valued the human element without having to spell it out – I doubt this, but it’s possible.

The Most Basic Element of All Waste is Time

With Lean, time is incorporated in many ways: cycle time, value added time, non-value added time, downtime, uptime, etc. Ohno simply broke it down in a way that made it easy to identify obvious targets to be addressed with appropriate techniques. Time is often thought of in terms of efficiency, but effectiveness – which is a way to describe the quality of a process – is a precursor of efficiency.

wasting time - A waste basket filled with clocks

Waste can be subdivided many ways. My take: It doesn’t really matter how many wastes you want to include.   If you think there are 20 different types of waste and this helps attack any one of them better; go for it – whatever works where you are. In the name of continuous improvement we must be willing to add or subtract in order to improve the system, right? Yes. Be careful though. We like to think categorically so more choices makes organizaing more difficult. And too many choices seems somehow less lean.

People Energy, Alignment and Engagement

Which brings us back to the concept of the waste of people’s intellect. When it comes to achieving operational excellence, a tremendous amount of time is lost by failing to engage people doing their daily work. Non-inclusion results in false starts, half measures, low sustainment and do-overs. Workshops and Kaizen Events may be common, but sustainable results are only achieved when people are tangibly connected to everyday improvement.

The Lean Waste Wheel with 9 Lean Wastes

The Lean Waste Wheel with 9 Lean Wastes

Alignment

Any attempt to be operationally excellent means real and sometimes uncomfortable change; which always meets resistance in some form. Alignment is about getting mostly everyone to support new ways of work. This is a cascading process where actions are different depending on ones place in the organization. If there was only one choice about what to align on however, it would be the need to engage people. The idea of defining people energy waste in specific terms, makes it easier to develop counter measures and a way of thinking about solving this problem that is similar to the other wastes in the wheel.

Engagement

Engagement means giving people a voice in the work they do and holding them accountable for improving things. Achieving broad engagement up and down the organization is tough for many. Kaufman Global uses structures like the Executive Steering Team, the Lean Daily Management System® (LDMS®), and Procedural Action Teams to create an environment that enables engagement. They’re simple enough to understand and do too. If methods are overly complicated, they are easier avoid.

When it comes to waste, everything revolves around time but it’s okay to define as many subdivisions as you like. If you had two to choose, I’d recommend lack of alignment and poor engagement as huge time wasters – possibly the most detrimental to any Lean system. When you get these right, smart people working together toward a common goal always solve the other problems.

**********

Notes:

  • Muda is the Japanese term for waste. This is the word Taiichi Ohno would have used.
  • A simple definition of waste is: Anything an all knowing, all seeing customer would not be willing to support (pay for).

If you want to learn more about Kaufman Global’s approach to engagement and alignment, check out SLIM-IT, Procedural Adherence and Lean Daily Management System. For a deep dive into the waste wheel and how it applies to Lean, check out our White Paper: Implementing Lean Manufacturing.

Designing Effective Workshops

Kaufman Global regularly leads individuals and teams at all levels of the organization through highly structured facilitation sessions. These can range from brief interactions with a single person such as progressive executive coaching episodes, to large groups of participants who need to solve a problem together. Over the years we’ve found  workshops to be one way to rapidly and effectively encourage team work, promote engagement, drive consensus, AND… ensure we actually have the much needed, but sometimes glossed over, healthy debate!  Some of the most common sessions we conduct with clients include:

  • Kaizen (Rapid Improvement) Events to address critical issues in production, supply chain, service delivery, and functional / administrative areas.
  • Strategy, Mission, Vision and Values Workshops – In fact, one of our best known sessions was done with the Oregon State Hospital and led to the Hope, Safety, and Recovery culture that is thoroughly embedded today not only at OSH, but at other state hospitals around the country (after they witnessed it at OSH).
  • Managers Lean Overview – This is a workshop we’ve delivered hundreds of times to thousands of managers and supervisors. It’s always customized, but contains at a minimum these elements: Leaders Role in Transformation, select Lean Tool awareness / orientation, Secrets of Human Behavior and Opportunity Identification activities.

In any such session, the key to successful facilitation lies in the upfront design and planning. While some of the tools and methods we employ are standard, the overall experience must be customized to the client’s objectives, audience and culture. When this is done well, we maximize the involvement and engagement of the participants and in return, derive the greatest value from the investment of their time and expertise. Our approach to designing and customizing facilitation episodes includes consideration of:

  • Objectives – Through initial client communication, we gain an understanding of the session’s overarching driver and objectives. In that discussion we learn about concerns, needs and urgency as well as the preferred topic concentration that might compel a workshop span of anywhere from a half-day to a week long.
  • Charter – From the initial collaboration we then draft a workshop charter. This charter promotes vital alignment and level sets expectations. It also relays to stakeholders a concise description of the issue(s) we seek to resolve along with other important information such as: naming the sponsor; identifying the facilitators; selecting the participants; and, episode logistics (such as venue, timing and meal requirements). Once these basic elements are understood, team and stakeholder invitations are sent and more detailed planning begins – such as training module selection and material requirements.
  • Storyboard – To accomplish that planning and go a level deeper, we storyboard the workshop. In that activity, we describe the basic sequence of events and deliverables. A high level workshop flow often follows a sequence similar to:

Sequence of steps for designing effective workshops

  • Agenda – An agenda tracking the charter and storyboard framework is then prepared to keep the facilitated workshop’s hourly and daily activities on track. In this, each workshop is customized according to the challenges at-hand, meaning, specific tools and techniques are selected by the facilitator to meet expectations. Similarly, adequate time is allocated for the agenda’s various learning elements, investigations and breakout team functions.

Rapid Improvement Event (RIE) Fundamentals

What’s in a name?

Read more »

Kaizen Events 101 – Before, During and After

Your checklist for a holistic three-week plan.

Read more »

Performance Level Examples

This post is part of Kaufman Global Quick Takes: Close the Gap | From Plan to Action in 2021

Performance Level Examples > Lean Manufacturing

Lean Manufacturing Level Examples

Other keys include: Metrics, Standard Work, Workgroup Engagement, Pull Systems, etc.


Performance Level Examples > Oilfield Services

Oilfield Services Level Examples

Other keys include: Customer Order Tracking, Visual Systems, Workplace Organization, etc.


Performance Level Examples > Supply Chain

Supply Chain Level Examples

Other keys include: Demand Planning, Capacity Planning, Metrics and Measurement, Purchasing Performance, etc.


These performance levels are subsets of Kaufman Global 20 Keys. The 20 Keys are one part of the Rapid Performance Evaluation.

5 Critical Success Factors for Evaluating Operational Performance

Rapid Performance Evaluation

In this post, we outline 5 critical success factors for evaluating operational performance. This is an approach we’ve developed over years of working with clients who want a solid portfolio of improvement projects that are connected to metrics important to the organization.

“Ready, fire, aim.”
“If you don’t know where you’re going, any road will get you there.”
“Shoot from the hip.”

Bueller, Bueller, Bueller

These are not sayings you want to hear when you’re trying to set direction and plan for operational improvements. Yet, with poor planning, this is often how situations are described in hindsight. Even if deeper analysis is required, an efficient and effective gap assessment is an invaluable first step.


The best results come when you engage the organization from the start and use comparative benchmarks. The five elements described here, enable open discussion about operations and performance and are the starting point for an effective plan.

A good evaluation process has certain attributes. It:

  • Leverages internal experts and external viewpoints
  • Incorporates operational realities of the front line along with leadership priorities and,
  • Gives everyone a way to make an objective assessment of the gap between the environment that exists and a standard definition of “what good looks like.”

At a site or value stream level, when done well, reliable results can be achieved within a few days.

5 Critical Success Factors for Evaluating Operational Performance

  1. Confirm the top-level performance metrics for the location being evaluated
  2. Use a template that provides performance level descriptions for key elements of the operation
  3. Engage the organization from the start
  4. Combine objective ratings with subjective views (interviews)
  5. Prioritize opportunities and describe an implementation approach

1. Confirm the top-level performance metrics

For any operation there are 10 or so metrics that tell the story. For example: inventory, quality, productivity, turnover (people), etc. Vast amount of data does not always translate into usable information. Identify and confirm the critical few operational metrics and then use them as a guide for where to look more closely during the evaluation. This becomes the baseline. From it, progress will be obvious as improvements are made. Later on, more information and more analysis may be required, but for your initial look, keep it simple.

2. Use a Template

The best way to understand the gap is to use a template that describes different levels of performance for various functions. The level descriptions are based on an intuitive general definition of performance at each level. Shown here:

Performance Level Characteristics

From this foundation, more detailed descriptions can be built for multiple areas of concern. We typically apply 20 Keys for such an evaluation. An Key example (quality) is shown here.

Quality at the Source performance key

For more examples in several industries and functional areas, go here: Performance Key Examples for manufacturing, oilfield and mining, supply chain.

3. Engage the Organization from the Start

Those working inside the process – at the Gemba, know the most about what is really going on so get them involved from the start. They use the template that describes performance levels as a guide for rating each element. The results show areas of opportunity.

At the same time, the leadership team and functional heads understand areas of concern for the top-level metrics. By interviewing these individuals, patterns emerge. The strengths and opportunities across the organization start to become apparent.

By engaging the organization broadly, everyone owns the answer and the plan. You get better inputs and ensure greater success when it comes to implementing changes in the name of better operational performance.

4. Combine objective ratings with subjective views

A rating system gives the organization a way to establish a baseline, clarify gaps and then measure success. As improvements proceed, better ratings show tangible evidence of the gaps closing. We use a series of three assessment tools that provide different ratings:

  • Interviews – These subjective opinions matter. With a standard set of questions, priorities emerge. And we can identify alignment issues that need to be reconciled.
  • Vital Systems – Using the same 1-5 rating system levels noted above, we evaluate 10 vital systems including: customer focus, supply chain, engagement, etc. Relevant vital systems vary according to industry type. Each system is described in a way that identifies its critical elements. Vital systems evaluation provides a big-picture view of the operation.
  • 20 Keys® – The 20 Keys does a drill-down into the details. They provide guidance on specific improvement activities and exactly what must be done to get to the next level of performance.

5. Prioritize Opportunities and Describe an Implementation Approach

Once the evaluation is complete and the gaps described, the question becomes, “What next?” This question must be answered at least at a high-level. An evaluation that takes less than  a week won’t yield a detailed implementation plan and business case, but it will answer questions such as: top operational priorities, engagement issues, leadership alignment and recommended next steps.

Internal and External Views

The internal team knows the most about what is really happening inside the operation. However, even with a good template that has standard definitions, they still have a subjective view. A level of objectivity and broad experience can be extremely beneficial. This usually comes from the outside. A good evaluation balances these two views and enables collaboration between them.

Conclusion

When done well, an evaluation of operational performance is a fantastic starting point for real change and improvement. Follow the 5 success factors described here and you’ll be miles ahead in your efforts.

====

Kaufman Global conducts Rapid Performance Evaluations for clients everywhere. Contact us to learn more about this powerful, inclusive, template-designed method for reading your operations fast.

Learn more about how we think about the topic of Analysis as it relates to our service offerings, click here.

Or, see our post on analyzing extended value streams: Making the Case for Analysis.

The “Real” 3 + 2 Rules of Successful Project Management

I’ve got your “REAL” 3+2 rules right here.

In my earlier career before I became a Lean-head, I held progressively responsible engineering and management roles within the technology sector. Those were the days. Silicon Valley was positively sizzling — the engineer’s revenge. If you didn’t take at least three after-work meetings each week with your personal headhunter (aka, the Long Island Ice Tea enabler), you were branded a “going nowhere slacker”.

New breakthroughs were scheduled daily by suit-wearing big bosses far above my salary grade who vaguely recalled from college that Ohm’s Law was some advanced form of guided meditation. These were the same guys who had long since forgotten the importance of performing a credible tolerance stack-up… you know, one good enough that you’d trust the safety of your family with the product. Anyway, since no one told us we couldn’t develop new stuff all the time, and capital was positively e-v-e-r-y-w-h-e-r-e, we blissfully did make new things every day… uh… that is, blissful for the most part.

With some early performance wins on my part, and a willingness to accept accountability for my actions, my career swiftly blossomed into leading the development cycle for the hardware I used to touch. Like all the other new Project Managers, I thought my job was more or less to get people organized to meet contract and technical requirements. At the time, we used a genuine bleeding-edge breakthrough called the “Integrated Product Development Team” (IPDT). (May say more about that another time because it’s not what this post is about. For our purposes here, just imagine what it might be or refer to the link.)

Among the IPDT’s rollcall were many of my former colleagues from the high-tech trenches. That description of them mainly denotes that we took morning breaks together and were on the same after work (when not with our headhunters) beach volleyball squad. Sometimes we even accidentally put on each other’s lab coats — and then laughed about it. Still a crack-up.

The first time out of the chute with my very own IPDT I detected some interesting characteristics among my former frontline collaborators; qualities that I had not previously perceived through my 5% pink-tinted tech-nerd spectacles (caused by early-onset presbyopia from scanning too much fine print).

First off, some of the team were unaware of the difference between reality and illusion.

We now know that at the root of this problem was the influence of freshman philosophy and psychology classes foisted upon these poor souls before their brains had fully developed.

Others had no concept of time.

That one was harder for me to fathom as I had been acquainted with several of these folks since our foundations in public school. I was certain that calendar and timekeeping theory had been covered, even in home room… more than once. And it wasn’t that long ago. Of course, back then the bell sounded to change classes at the end of the period, so that helped bridge the gap.

Many of the rest simply couldn’t make decisions – at least not very quickly.

Okay, I kind of get that one. I mean, things were changing so fast that – if – you simply waited for the fabled “optimized solution” with “better data”, you could easily justify taking four weeks to place an order for a simple digital multimeter — because hey, everyone knows that newer one will be way better.

As I pondered emerging perceptions concerning my mates and considered how to best manage my troubled sentiments about our workforce in general, I was also fortunate enough to work for a string of really excellent bosses who, in composite, laid down an easy to remember set of rules that absolutely addressed all of these concerns and has served me well. Now, it’s true that there are countless tomes available on the machinations of best-in-class project management that I might have referred to instead. On the other hand, these rules are simple enough to remember and actually use. For each, I’ll inform, then briefly expand upon the real 3 + 2 rules of successful project management – the only ones that genuinely matter.

Since you’ve been patient and probably only scrolled down two or three times to look ahead for some concise table that images well on the screen of your Galaxy S8+, I’ll now share them with you here.

RULE 1: If it exists, show it to me.

  • Elegantly simple it its demand, we have an agreement that something which occupies space and has mass should be here today. Nothing else will do… Really.
  • Enlightened manager query: Ryan, could you use some help with keeping your commitment?

RULE 2: Time stops for no man.

(I mean, person… I mean, associate… I mean… oh, crikey… recurring attack of charm school political correctness. Thought I was cured. Sorry everyone.)

  • We have competitors. I’ve been told that the definition of ‘competitors’ is that they do everything better and faster and seek to annihilate us… Really.
  • Enlightened manager solution: Look everyone! Who could have dropped off this crate of day-planners?

RULE 3: Make a decision; if it’s wrong, we’ll make another one tomorrow.

  • Chances are darn good that you know the right thing to do. You’ve got a 4.0 Stanford BSEE, right? Wallow in indecision if you must. Or better yet, take a leap and be handsomely rewarded… Really.
  • Corollary to rule 3: I said make a decision, not any decision. If you make a decision and it doesn’t work out, you’ll still be here tomorrow for the redirect. If you make any decision as a habit, eh… probably not so much.
  • Enlightened manager recognition: Chris, well done, just what we needed. You da’ bomb!

Later on, inspired by notable IPDT outcomes while observing only the prior three rules, I was then prepared to absorb the following two concepts that I’ve discovered apply almost universally… bonus rules I include just for you.

RULE 4: Where there is the shadow of a doubt, there is no doubt.

  • If you’re positive that “Casey” is stealing from the company, everyone else knows too. And if Casey openly admits he / she is stealing, then there’s a good chance you’re all correct in your assertion. No mob mentality here, just common sense… Really.
  • Enlightened HR Manager’s role: Casey, I need to inform you that we are separating you from your employment here today. (Can you guess why this act is enlightened?)

RULE 5: Hope dies last.

  • Special corollary of rule 4: Waiting for Casey’s behavior to improve and return the money he / she embezzled from the company reveals what a truly great heart you have. But, it won’t happen… Really.
  • Enlightened project manager’s take: I could buy some time, heal Casey, and lose the respect of all my honest project team members who are just trying to get something done and have some fun with like-minded people – or not.

That’s it dear readers. The real 3 + 2 rules of successful project management. These should spare you years of tedious discovery and position you for speedy domination, control, uh… leadership of your market space.

***************

See how we helped a West Coast based biotechnology company streamline their contracting process so that new drugs could be brought to market more quickly and with higher quality. Read the case study –>


Implementing Lean Manufacturing: Part 1 of 3

Introduction

Kaizen Japanese symbol

Kaizen is a Japanese word that means “small, ongoing good” (kai) and “good, little, for the better” (zen). The term has come to mean small, continuous improvements by hands-on workers all the time.

Lean manufacturing has become synonymous with world-class operational excellence. Under various names (synchronous, pull, demand flow, flexible, cellular, just-in-time, one-by-one), Lean is the single most powerful strategy for improving a production operation’s competitiveness. The dominant players in every market segment are aggressively implementing Lean as a strategic weapon because they realize they have no choice. If they don’t “do Lean” and stay Lean, they will quickly fall behind the market leaders because they are less able to adapt to an ever-changing competitive environment.

This white paper is directed at organizations that are either eager Lean practitioners or those who have not yet had a Lean awakening. Both will find value in its explanation of the foundations and basic mechanics. Additionally, this paper describes Kaufman Global’s specific approach to Lean implementation and our learnings over years of working with clients. Our method is holistic and pragmatic, reduces implementation time, increases benefits and ensures sustainability. Kaufman Global has pioneered several techniques that are in wide use across a broad spectrum of industries and business today, including: the SLIM-IT® model for implementation, Lean Leadership®, the 20 Keys® and the Lean Daily Management System® (LDMS®).

A Definition of Lean Manufacturing

Lean manufacturing, or Lean, is an integrated leadership philosophy, management system and set of tactical methods / tools that focuses on creating an operation with minimal amounts of nonvalue-added activity, inventory (Raw, Finished and Work-In-Process) and errors. The primary engine for eliminating nonvalue-added elements in  Lean system is the employees who do the hands-on work.

The Benefits of Lean

While the mechanics and approaches of Lean may not be clear to everyone, there is little doubt concerning the magnitude of potential benefits. Years ago, in order to get people interested in the notion of Lean, it was necessary to quote double digit percentage savings from process improvement. Without making that list here, in our experience any process is capable of a 10 – 30% improvement if Lean is applied with some rigor. This is in any and all dimensions whether it be cycle time, lead time, quality, inventory, customer satisfaction, absenteeism, etc.

Results like this cannot be attained by chance or half-hearted, informal initiatives. They can only be generated through carefully planned and aggressively supported efforts that are overtly led by management. Isolated improvements have no chance of leading to an organization-wide transformation of day-to-day behaviors, expectations, metrics and the entire system of work.

The Evolution of Lean Manufacturing

Figure 1 is a conceptual diagram showing the progression of Lean between the 1940s and today. Lean would not have emerged as a structured system when it did (or at all, perhaps) if it had not been for two circumstances. The first was the condition of Japan after World War II. Totally devastated and with few resources, Japan could not compete with other industrialized economies on costs, volume or quality using standard mass production approaches. There wasn’t enough money to build modern factories or buy modern equipment. Japanese manufacturers had to “make do” with what they had; and they had very little. This massive handicap created the ideal conditions for the true catalyst of Lean to operate.

This second circumstance was the pioneering thinking of Kiichiro Toyoda, Taiichi Ohno, and Shigeo Shingo. Their focus on low-tech, pull systems and the elimination of waste evolved into the Toyota Production System (TPS) over the period from 1945 to about 1975 (the original, Toyoda, was changed to Toyota for American consumers). The 1990 book, The Machine That Changed the World by James Womack, et al, popularized the term Lean manufacturing to refer to the TPS and its derivatives. Other generic names for the TPS are flexible, cellular, one-by-one, pull, synchronous, demand-flow and World-Class manufacturing. Also used are just-in-time and kaizen although both are only elements of the TPS, not the entire system.

Starting in the mid-1980s, the large automobile manufacturers adopted many of the basic principles of the TPS, but each changed the name to something that sounded more “home grown” to their employees, customers and shareholders. Other companies have since taken the same approach. Thus, it is common to find that Company X has the “X Production System” in place. Peel back these “labels,” and you find significant elements of the TPS underneath.

During the 1990s, it became apparent that there was plenty of room for Lean application far flung from automotive assembly and well beyond the factory floor. This started the integration of methods and techniques that is still going on today – Office Kaizen is one example. As organizations from all industries, sectors and segments embraced adaptations of the TPS, new tools and methods were developed and Lean continued to evolve.

In the mid-2000s, the term operational excellence or “OpEx” started becoming the popular catch-all phrase for operational improvement of any kind. It allows for the inclusion of a multitude of techniques – especially the integration of Lean and Six Sigma – and is often more acceptable to the ears of those in non-manufacturing pursuits. The generality of the term is also its weakness because anyone doing anything to improve performance can proclaim they have OpEx – which may or may not be true.

While the basics never change, the Lean of today has many additional bells and whistles that Toyoda, Ohno and Shingo did not develop but would have welcomed. Anything that enhances the fervent elimination of waste is part of Lean.

Implementing Lean Manufacturing: The evolution of Lean manufacturing from mass production, to the Toyota Production System, to the people-focused Lean enterprise

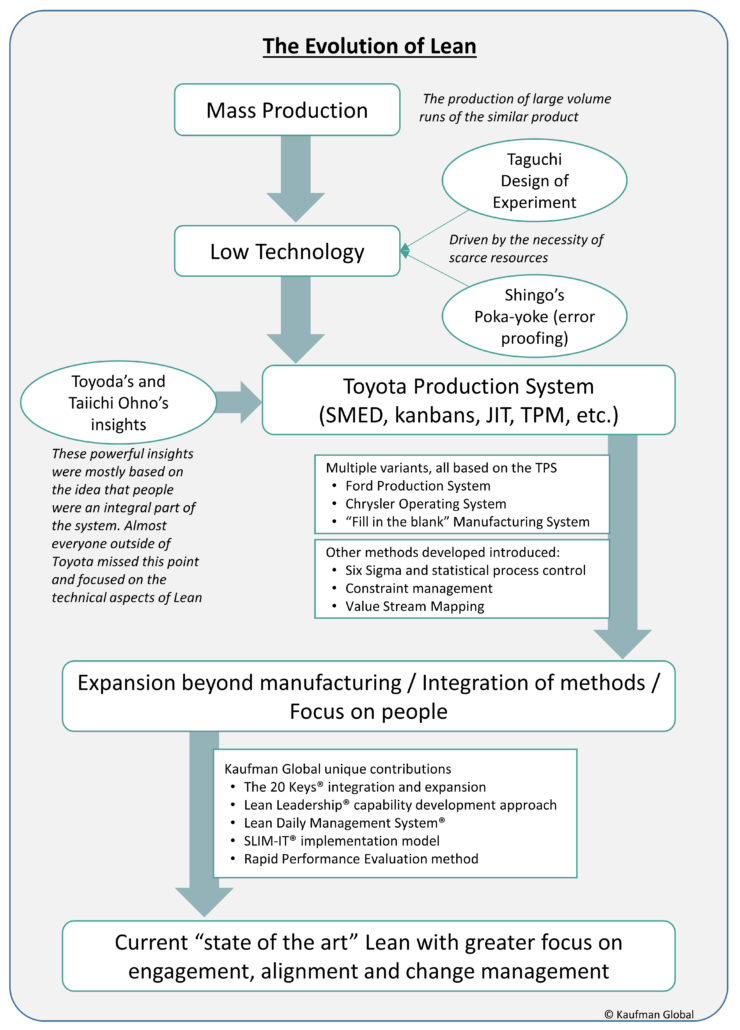
Figure 1: Where Did Lean Manufacturing Come From, Where it is Going

Pull Versus Push in Lean Manufacturing

A critical distinction between Lean and traditional systems is the pull philosophy of Lean versus traditional manufacturing’s push philosophy. Figure 2 displays the mechanics of a typical push system with three employees working on three consecutive processes. The curved arrows represent sequential actions of each process step. In this example, each of the three workers does his / her work at the same time independently and then passes the completed item to the next worker. We assume that each worker performs each and every task at a constant rate of speed.

Conceptual representation of a traditional push system prior to adoption of lean manufacturing principles

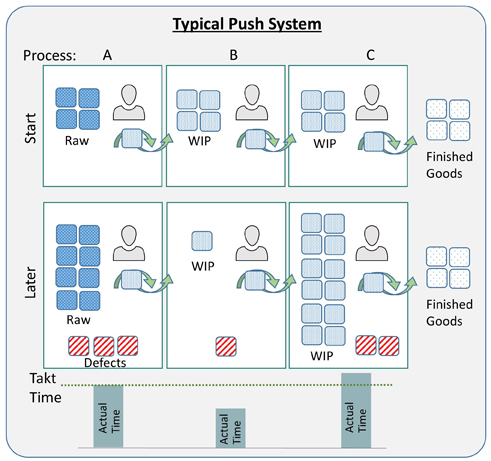
Figure 2: A Conceptual Representation of a Push System

The “start” scenario illustrates the situation in the cell as it has just started to work on a new product. The Process A worker has four pieces of Raw inventory waiting to be worked. There are also four pieces of Work-In-Process, or WIP, waiting for both the Process B and Process C workers. Each worker has one piece of work at their station. There are four pieces of Finished Goods waiting to be picked up after Process C.  In Figure 2, the processes are not balanced. We know this because the workers, operating at a constant rate of speed, require different amounts of time to do their work. Takt Time (TT) is noted for each process. Because at least one of the workers is over the Takt Time (TT), it will be impossible for the three-person workgroup to meet customer delivery demands unless additional resources in the form of time or people are added.

Takt is the German word for “cadence” or “rhythm” (pronounced “t-ah-k-t” in German but typically pronounced “tack” in English). In the TPS, Takt Time is the heartbeat; it is the standard time interval between the each output of a product from a process that is required to meet production demand.

TT is obtained by dividing the total amount of work time in a day or shift by the required output. That is: Takt Time = total time in seconds / required output. The bar graph below each process represents the amount of actual time that each worker requires to perform their work to the product.

The rate of completion of work for each process varies because the work is unbalanced: Process C takes the longest, B is the fastest. Process A tasks are the only ones that match the Takt Time exactly.

After some period of time operating under the typical push philosophy, the original “start” situation has evolved into the “later” example shown in the bottom half of Figure 2. With a starting level of four pieces of inventory between each worker, Worker B frequently ran out of material because they are out of balance with the preceding process (A). The supervisor or manager, uncomfortable at seeing an idle worker and believing that any work is better than none, ordered that more inventory be added so that Worker B could stay busy. This typically happens as managers strive to make “earned hours” or “standard labor hours” look better. If the workers in Processes A, B and C are operating machines, the quest for better “absorption” numbers creates additional pressure to build up inventory.

Raw material accumulates with Worker A because it is pushed to the operation by Materials Management and Production Control. More and more inventory is added until all workers are kept busy all the time. The result is masses of inventory of all types – Raw Materials, WIP and Finished Goods. Upon seeing busy workers and a lot of inventory, managers receive the false perception that considerable value is being added and that there is a lot of product almost ready to meet customer demand.

The total output of the combined processes of cells A, B and C can only ship at the rate that Process C can complete the work. If any process downstream has a problem, other upstream processes will continue to churn out inventory. All of the WIP and Raw inventory is irrelevant to meeting customer requirements. All of the labor that is added to inventory that cannot be shipped is waste – and no, it is not “pent-up value.”

Worst of all, because everyone appears busy, the issue of unbalanced work between the three workers and the inability of the cell to meet takt time is seldom addressed.

This is the root cause of the entire inventory buildup. Rather than focusing effort on balancing the work in the cell, the push reaction is to resort to overtime, more workers, more expensive equipment, or all three.

Note the diagonally striped squares that appear in the “later” scenario of Figure 2. These are “problem” assemblies: a part was bad, an assembly error was made and / or a component was missing. When one of these problems occurs, the unit is pushed off to the side for later assessment. However, in most push systems, these problems are rarely addressed — and, when addressed, never timely. With the organizational imperative to stay busy and make more, the problem units appear insignificant among so much other inventory.

Figure 3 presents analogous “start” and “later” scenarios for a pull system. A detailed examination of demonstrates the power of a pull system to overcome the problems created by the push approach. In the “start” configuration, the times for each process to complete one unit are identical to those in Figure 2, as is the TT.

The first thing noticeably different about Figure 3 is that there is little inventory. This is not something that happens all at once when transitioning from the Figure 2 push system, but is a gradual result of moving towards a pull system. The second major difference is that the three processes do not work independently. Work is always “pulled” from upstream.

Conceptual representation of a lean manufacturing pull system with takt time, WIP, kanban signals and finished goods

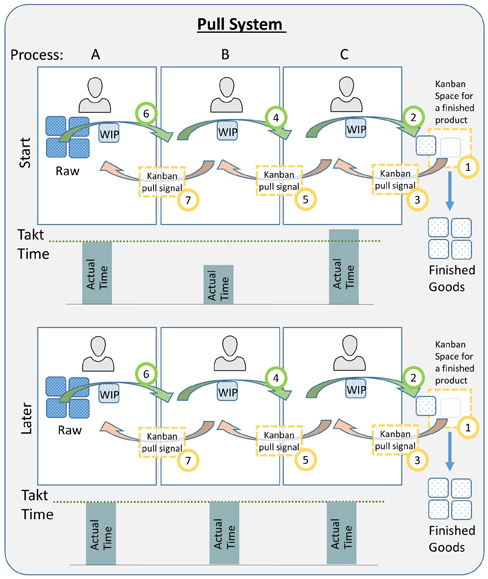
Figure 3: A Conceptual Representation of a Pull System

The pull begins when the completed unit at station one (1) is removed. This creates an empty spot, which generates a need that pulls the completed unit from Worker C. This pull message is called a kanban (denoted by dotted box in Figure 3).

Kanban in Japanese, originally meant “store sign.” It is said that Kiichiro Toyoda got the idea for the pull system from a visit to a US supermarket after World War II (goods pulled off the shelf today are replaced tomorrow). In reference to what he had seen, he called a pull signal a kanban (rhymes with “bon-bon”).

A kanban can be a spot on the floor, a pallet or a piece of paper attached to the material or the material’s container. Traditionally, it was a card or sheet placed in a see-through pouch. The kanban states what it can accept.

For example, if a pallet is the kanban and a pallet can hold 16 assemblies, Worker C could continue to place work on the kanban until it has reached its limit of 16.

At that point, no more units could be added to the kanban. Worker C would have to stop working after completing the unit in front of him and wait until the kanban was emptied. In our example, the kanban only holds one piece. If the downstream kanban is full and Worker C has completed work on the at their station, they must stop working and wait. Nothing can move without a kanban, only Production Control can create new ones.

The beauty of the pull system is that if there is a problem at a downstream process, the entire line stops. No worker is permitted to work on another unit and / or build up inventory unless a kanban arrives. The “later” scenario in Figure 3 shows that the three processes are more balanced than at the “start” scenario. In a pull system, there is a continuous effort to balance work between adjacent processes workers and cells to eliminate waiting and reduce WIP inventory.

Also note that there are no problem units in the later scenario. Since inventory is not pushed along the production sequence, each problem unit in the pull scenario creates an “empty spot” in the process chain that cannot be hidden by WIP inventory. Management and employees are energized to address problems by the very nature of the pull system. As a result, errors decrease and quality improves.

**********

If you’re ready to read the entire white paper now, click here to access it via our Resources page.

This post is the first excerpt in a 3-part series from Kaufman Global’s updated white paper, Implementing Lean Manufacturing: A Holistic Approach. In this paper we discuss:

  • An integrated model for Lean implementation
  • How to improve engagement and alignment
  • Why “pull” is so fundamental to Lean success

In this installment: THE EVOLUTION OF LEAN AND WHY PULL IS SO IMPORTANT, we describe the foundations of Lean over the past half-century and why pull vs push is one of the most fundamental aspects of any Lean system.

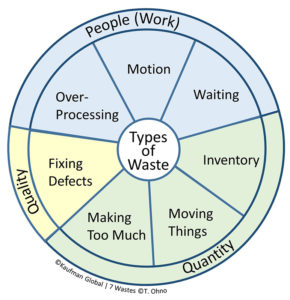
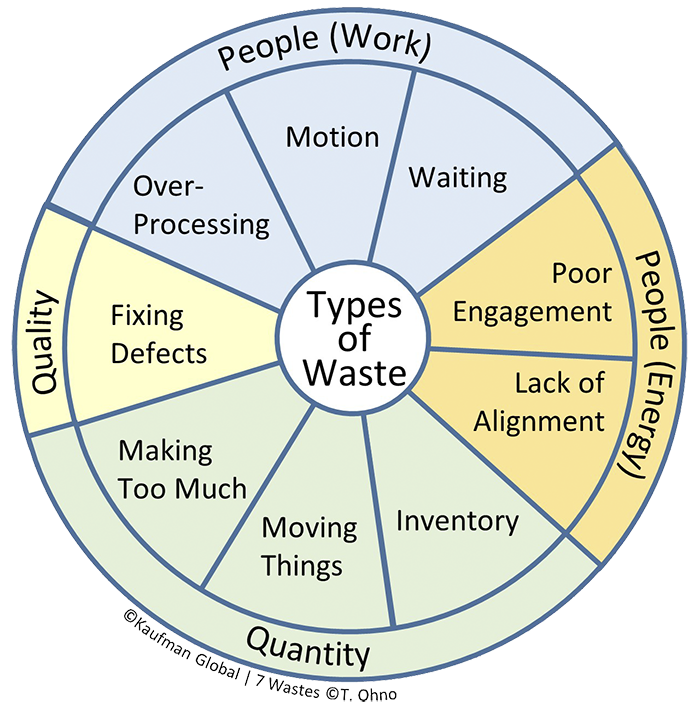
Part 2 discusses why Taiichi Ohno’s original 7 wastes must be updated to include two new ones: Alignment and Engagement – which if not addressed will foil any implementation.

Part 3 provides an easy to understand table that shows the systemic nature of Lean: wastes, approaches, methods, tools and results and describes a fail-proof system for implementation. For over 20 years Kaufman Global has pioneered the interface between people and process, always with engagement and alignment at the core.

Rapid Performance Evaluation – Speed Matters

Rapid Performance Evaluation: Standard Work for Identifying Operational Performance Gaps

Kaufman Global helps clients solve complex problems and drive fundamental improvement. We engage when people and process collide – places where expertise and leverage can speed results. Even when an organization knows there is a problem, understanding operational performance, getting to solutions and knowing which levers to adjust can often benefit from outside perspective.

Rapid Performance Evaluation (RPE)Over the past few years, we’ve observed that clients want answers faster than ever before. And while it could be that “time is money,” it seems to us that it’s more related to the frenetic pace of, well, everything these days. Headlines and “apps” often don’t dig deep enough and the “Ready, Fire, Aim” approach has great potential for missteps.

To meet the demand for fast but thorough answers, we devised an innovative method for quickly getting to the heart of the matter – operationally and organizationally. Our Rapid Performance Evaluation (RPE) uses a standard work approach to cut the time required for credible solutions to about a day. How, you ask?

Instead of only identifying and prioritizing process problems, the RPE delivers tangible feedback and scores that can be used to immediately take action to improve. The RPE:

  • Provides a comparison against well-defined standards and benchmarks
  • Ensures the leadership team is aligned on the issues
  • Establishes specific and prioritized things to work on now
  • Engages the organization out of the gate, reducing rework and improving data fidelity 10x
  • Is fast and agile – minimizing disruptions. Getting accurate info doesn’t have to take weeks

The process begins by on-boarding the team and communicating with site leadership. It ends with a report to same. Core attributes of the Rapid Performance Evaluation are noted below.

Visit the Gemba

The gemba is the place work is done. It’s the shop floor, the office, the warehouse, the lab or the medical unit. It embodies the concept of “Go look, go see” and is a vital step in collecting information for analysis. We’ve found it helpful to review immediately before the visit what we’re trying to “see”, so we use a standard set of definitions to focus our attention. For example, in an office environment one thing we look for is communication between functions. In a factory we want to understand how material is moved (pushed or pulled) and stored (inventory) from one location to the next. Lots of paperwork is not needed for reference. Our optics have been adjusted ahead of time so the visit to the gemba can be for observation and understanding.  We need to keep our eyes and ears open.

Template Driven for Simplicity

Templates are used to compare existing practices to best known practices. With the RPE, simple but proven definitions and an intuitive measurement system make it easy to get everyone on the same page when it comes to scores and ratings. We look at factors that correlate to overall performance, such as quality systems, teamwork, continuous improvement capability and material and information flow. The correlation factors provide a big-picture view and point to overarching or systemic causes affecting performance.

For more discrete aspects of the operation, we use the Kaufman Global 20 Keys ® to evaluate 20 critical elements that affect efficiency and effectiveness. For each key, the tool ranks the current level of performance using a 5-point scale where 1 is “Traditional” and 5 is “Currently Invincible”.  Levels are described simply so the requirements for achieving the next level of performance are easily understood. The 20 Keys dig a little deeper than the correlation factors by identifying and prioritizing specific things to work on.

Alignment  Speeds Change

No matter how good the templates and rating systems are, they don’t account for the human factor. Opinions matter. During the course of the visit we interview key leaders and stakeholders. This usually means functional heads who have valuable insights and who will play a critical role in any changes moving forward. We start to see how much (or little) agreement there is about the underlying issues. This is an area where being external to the organization is a key advantage. Functions are typically protective of their turf. Outsiders can ask more probing questions. If there is a significant difference between what we hear from the leaders and what we see on the ground, we sometimes opt to survey the organization. This can help identify broader organizational issues.

Balance Speed and Accuracy

The RPE is done with a small joint team comprised of Kaufman Global and the client. Since the method is standard, well defined, intuitive, and template driven, training for the client participants can be completed at the start of the day. The real benefit of this simplicity becomes clear at the end of the day when scoring begins. After we’ve completed the tour and interviews, we individually rate and rank based on our personal observations. Then, we come together to discuss and negotiate consensus results. The evaluation is better because it consolidates multiple views, experiences and vantage points and compares actual performance against intuitive and easy to understand benchmarks.

Results

Any operation can be assessed for performance quickly if the method considers all of the output requirements and integrates change management approaches. The RPE gives leaders rational ratings of performance, a clear understanding of organizational challenges and confidence that they’re spending energy in the right places.

Find an example of the approach and results here: Rapid Performance Evaluation (RPE) Case Study: Automotive Electronics.


4 Tips To Simplify Work Complexity

Complexity means more options for failure.

Complexity Is Naturally OccuringPeople and processes come together to deliver products and services. Like a ball of string collected, complexity builds as things are added to accommodate the dynamic environment: organizations, procedures, technologies, reporting, etc. This “growth” happens incrementally and naturally in every business. Simplification can overcome complexity, but it takes energy to accomplish.

When two entities merge and attempt to integrate, the chaos is more obvious. Either way, the interactions are seldom or appropriately examined to determine what can be eliminated.  Ultimately, the patchwork of fixes and micro-solutions generate systems that are more complex than they need to be. They are difficult to understand, standardize and control.

Complexity doesn’t automatically resolve itself. Some organizations endeavor re-design from time to time, but the work is typically limited in scope and stays inside functional boundaries. Here, there are plenty of examples of success in areas like Finance, Manufacturing, Product Development, etc. When we explore enterprise value streams that cross boundaries―for example the alignment of Sales, Product Development and Production, it gets a little tougher. Even so, opportunities to improve competitiveness are vast, therefore it makes sense to take a broader approach and navigate the stream through the enterprise. Results are more assured when the initial work is well planned and executed with precision.

1.    Inclusive Workshop Aimed at Reduction

A structured workshop is the best way to begin. This may be a single event or a series of sessions. It goes beyond getting a few people together to compare ideas. Top considerations are:

  • Leadership engagement (governance)
  • Simplification Team participants and
  • Implementation imperatives.

To determine scope, start with the system of people and processes that you have; the current state. Some will argue it’s better to begin with a clean-slate, but really, there is no such thing. In rare situations where there is no process to begin with, gaining a systems understanding without preconceived notions is more or less impossible. Besides, in most cases, products or services are already flowing. So start here to decipher the variables that are adding value.

2.    Governance and the Politics of Change
Governance

Once you’ve got an idea about the scope of work, it’s time to get the right leadership engaged. First, determine the major processes and or functions that are part of the system. Then identify the single point of control for all of them. For many organizations, the control point for value streams that bisect the enterprise is the CEO. This isn’t so surprising when you consider the rich mix of silos, shared services and dual reporting structures that exist within most organizations. Single-point control at high levels is the main reason simplifying enterprise value streams is difficult, and why we often settle for optimizing functions or sub-processes. Don’t settle.

The control point then directs the functional leaders to participate by forming a coalition to govern the progress of the workshop (and beyond). This direction is the catalyst for action and it is a critical step. The task often requires more effort than initially expected, so be prepared with enough up-front work to make an effective case for change.

3.    The Simplification Team – Dealing with Data, Facts, People and Emotion

The workshops are staffed by individuals who work inside the existing system and therefore understand the most about what it delivers and how it functions. They also tend to defend the status quo but will probably be part of the change moving forward, so get them involved them early. You’re digging into things that people have built over time. Don’t underestimate the work required to keep this team motivated and on track.

Include some who don’t operate the existing system to get an unbiased view and to ask the “obvious” questions. In the ensuing conversations, you’ll hear “You don’t understand.” a lot – which is exactly what we want. Through these interactions, the team gains clarity about the system as a whole, instead of just their part of it.

4.    Consider What Comes Next
Simplification

The workshop decision is taken, simplification is an objective, the processes and people are known and an accountable Steering Team is enlisted… all good. So far the task at hand doesn’t seem too daunting.  Now, as part of the workshop, go beyond simplification design and consider implementation. What will it take to operationalize the changes?

Workshops get things rolling by providing an output that describes processes at a high level. As the future state becomes current state in the real world, change is managed and kinks are worked out in-situ. The new system is built by standardizing processes as they emerge and then attaching and adhering to relevant procedures. Don’t add complexity back in by over-prescribing. Simpler definitions are more likely to be adapted, provide fewer options for things to go wrong and give more room for value-driven decisions to be made at the right level.

 ***********************

Complexity happens naturally. Simplification does not. People are frustrated working in bloated, ineffective and inefficient systems. There are no silver bullets, but smart design is a great starting point. Use an inclusive, holistic approach to extract solutions, identify value and restructure the work. Then engage the organization for extraordinary results.