Cause and Effect Diagram (Fishbone, Ishikawa Diagram)
Cause and Effect diagrams – also known as Fishbone or Ishikawa Diagram – are useful for understanding the causes for certain results. The following diagram illustrates the construct of the tool.
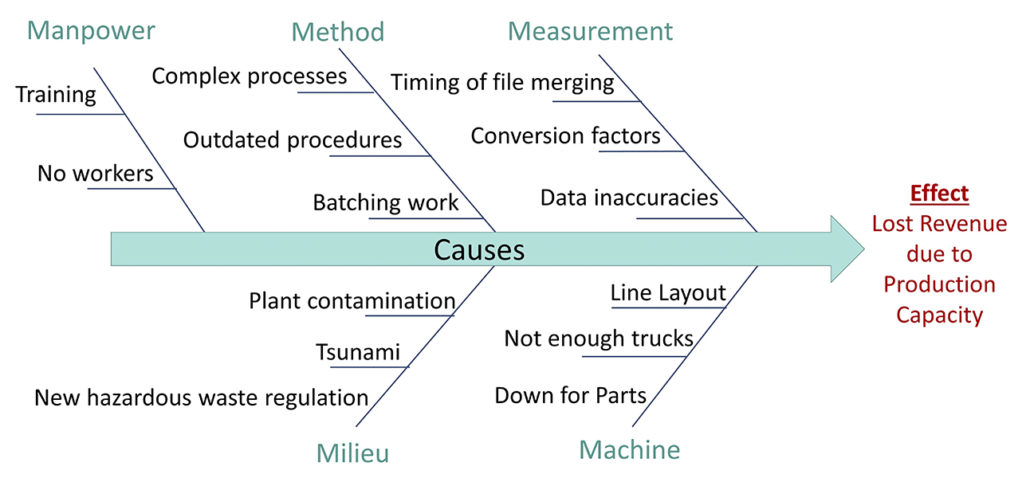
Cause and Effect Diagram with 6Ms of Production as Categories
The Effect is noted on the right side of the diagram with major categories of causes organized around a central spine that leads into the Effect. In this diagram we have used the categories outlined in the 6Ms of Production (man, machine, material, method, mother nature and measurement). However, major categories should be determined according to the issue being analyzed.
Specific causes related to each major category are arranged along the lines leading from the category heading and into the central spine of causes.
Cause and Effect diagrams are useful for understanding the variables that might impact certain results. They can be constructed by an individual, however it is often more useful to involve a broader team in brainstorming sessions. Sometimes additional categories are identified and added to the diagram via the brainstorming process.
Cause and Effect diagrams are not intended to fix the causes they identify as problems. Instead, they are useful for understanding and prioritizing these causes. Once the top causes are identified, additional analysis can be done. This analysis might include data gathering to understand the degree of causation or deeper dives into the issue via techniques such as 5 Why Analysis or Impact / Effort Matrix.
« Back to Glossary Index