Gantt Chart
In simple terms, a Gantt chart is a horizontal bar chart that helps visualize project status or multi-step / multi-function process. It is used as a project management tool with tasks on the vertical x-axis and time on the horizontal y-axis. Bars are designated for tasks, starting at the beginning of the task and ending when the task is complete. In this way, one can compare original project plan with actual timing and determine if the project is on schedule or not.
Gattt charts can be simple or complex. For simple ones, Microsoft Excel is a good starting point. For more complex charts and project plans, Microsoft Project works. It is a project-planning software program that uses Gantt charts to visualize project status. Swim-Lane process maps are a form of Gantt chart that shows information flow between functions.
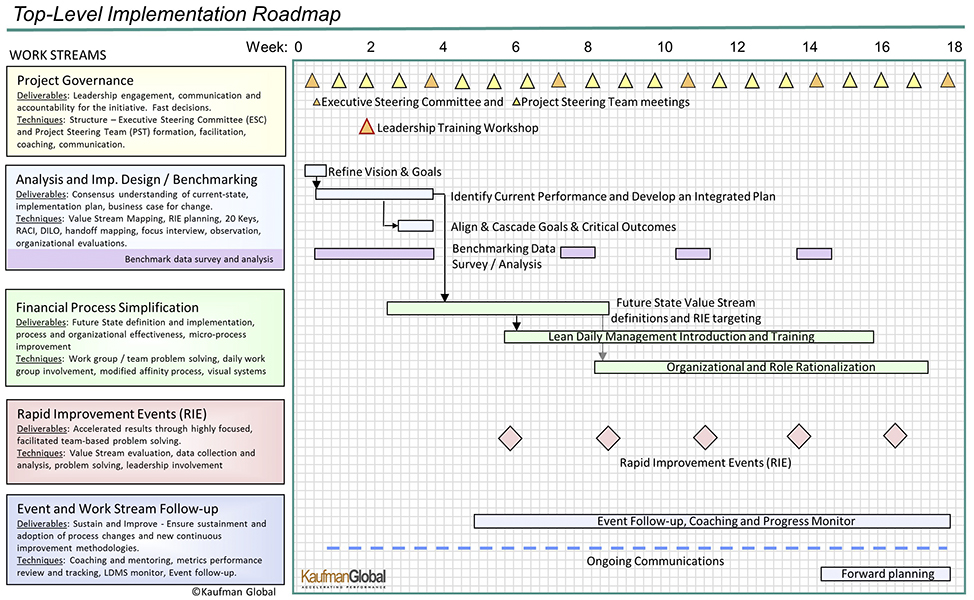
Here is an example of a Top-Level Implementation Plan, also known as an Implementation Roadmap: